2018/2019 Orange Crop Forecast for São Paulo and West-Southwest of Minas Gerais Citrus Belt
The 2018/2019 orange crop forecast published on May 09, 2018 by Fundecitrus, in cooperation with Markestrat, FEA-RP/USP and FCAV/Unesp1 is of 288.29 million boxes of 40.8 kg each. This total includes:
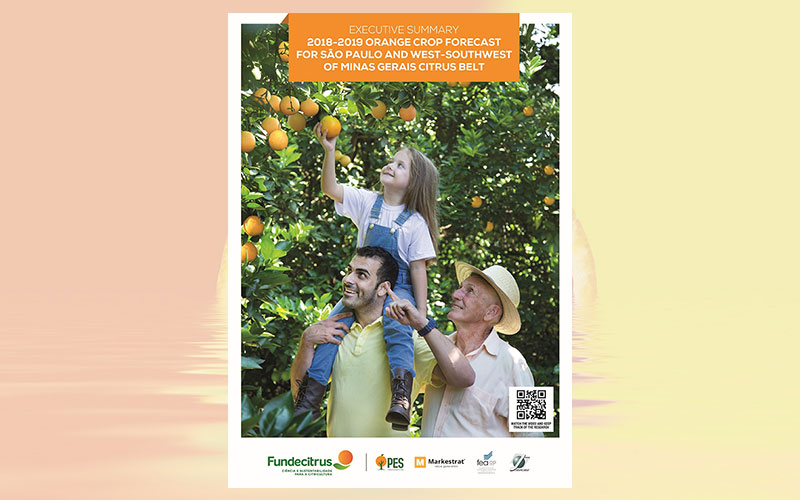
The 2018/2019 orange crop forecast published on May 09, 2018 by Fundecitrus, in cooperation with Markestrat, FEA-RP/USP and FCAV/Unesp1 is of 288.29 million boxes of 40.8 kg each. This total includes:
- 55.81 million boxes of the Hamlin, Westin and Rubi varieties;
- 16.55 million boxes of the Valencia Americana, Seleta and Pineapple varieties;
- 81.16 million boxes of the Pera Rio variety;
- 99.80 million boxes of the Valencia and Valencia Folha Murcha varieties;
- 34.97 million boxes of the Natal variety.
1. Bearing trees
Bearing trees of the varieties which make up this estimate total 175.27 million. Information about bearing trees was obtained from the Tree Inventory for São Paulo and west-southwest of Minas Gerais citrus belt: March 2018 status, defined by the new mapping of groves performed from September 08, 2017 to January 29, 2018 and by counting of trees present in 5% of plots mapped, from January 29 to March 07, 2018
The georeferenced mapping, carried out for the first time at the 2015 Inventory, has been through a complete update for this 2018 Inventory. New high definition orthorectified images were obtained by the satellites SPOT 6&7 from European Airbus Defence and Space between May and August, 2017. In September, 2017 images were made available to survey agents, together with drawings of plots identified in the previous mapping, which were superimposed to the images for easier visualization of areas that should be visited to collect in loco data. Scanning or visual inspection of images were also employed by survey agents before they went to the field to pre-identify citrus groves planted after the previous mapping from 2015 to 2017, which should also be visited.
No information relative to the plot other than their outlines was supplied to survey agents, which required all new data to be collected on: variety, year set, spacing, visual aspect of plants and irrigation system, when present2. Recently collected data relative to the variety and year set that differed from the previous register were audited for validation. Outlines of plots were redrawn to correspond to their present area, whenever their area was changed after plots having been registered in the previous mapping. Field visits identified plots that were abandoned or eradicated after the 2015 Inventory, and those identified in that mapping as being in a similar situation, so that they were also revisited for updating data. A new feature in the current mapping is the delimitation of farms, which more precisely quantifies farms present in the citrus belt…
Please download the complete forecast under: www.fundecitrus.com.br/pdf


