


OECD overall R&D growth stable; government R&D budgets decline and reorient towards defence
Growth in R&D investment remained stable across the OECD in 2024, accompanied by tightening public budgets for R&D and a growing emphasis on defence, according to the latest estimates published in the …
Growth in R&D investment remained stable across the OECD in 2024, accompanied by tightening public budgets for R&D and a growing emphasis on defence, according to the latest estimates published in the OECD Main Science and Technology Indicators.
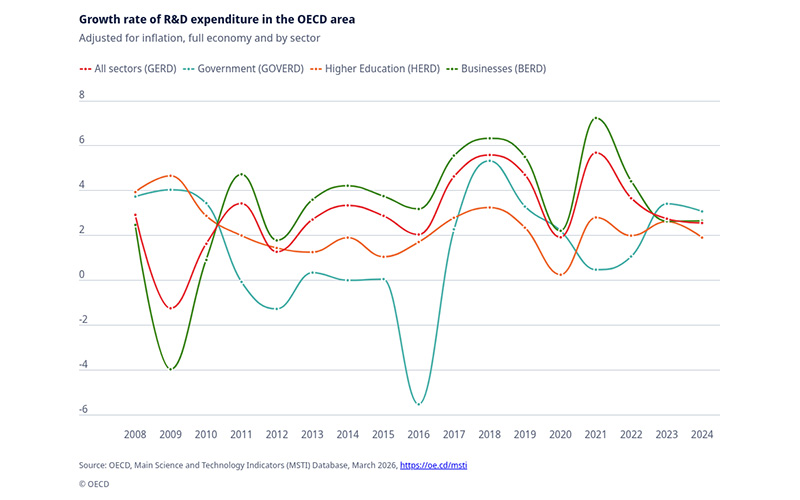
Growth in inflation-adjusted expenditure on Research and Experimental Development (GERD) in the OECD area remained at 2.6 % in 2024, unchanged from 2023. R&D expenditure rose in the United States by 3.4 %, while growth in the European Union stood at 0.4 %. Germany, its largest economy, recorded a 0.4 % decline. In contrast, Japan, Korea and Türkiye reported growth rates of over 5 %.
The business sector continued to account for the largest share of OECD R&D expenditure with 73 % of total GERD, up from 67 % in 2010 but unchanged since 2023. Growth rates in R&D spending across different sectors have converged after more than a decade in which R&D growth in the business sector significantly outpaced other sectors. While R&D expenditure in government organisations has recently grown by over 3 %, this has not been sufficient to reverse its long-term decline in relative importance. Growth in higher education R&D stood at close to 2 %.
The United States and China reach the one-trillion-dollar R&D milestone in 2024
The United States and the People’s Republic of China (thereafter “China”) consolidated their position as the world’s largest economies in terms of R&D expenditure, widening the gap with others. R&D spending comparisons that account for differences in purchasing power parity (PPP) indicate that China’s GERD caught up with and even surpassed the United States in 2024, at USD 0.86 trillion in terms of PPP-adjusted dollars of 2020, the benchmark year for National Accounts. This implies that expressed in 2024 prices, both China and the United States reached the 1 USD trillion mark.
The latest estimates suggest that global R&D expenditure may have reached USD 3.8 trillion in 2024. OECD countries account for almost two-thirds (USD 2.3 trillion), with the United States contributing 1 USD trillion, the European Union USD 0.6 trillion, and the remaining USD 0.7 trillion accounted for by other OECD economies. According to the latest available estimates from OECD for 2024 and UNESCO (projections from 2023), non-OECD economies other than China, such as Brazil and India, would account for close to USD 0.4 trillion.
Understanding international comparisons of R&D expenditure based on purchasing power (PPP) and average annual exchange rates (EXR)
While PPP-based comparisons are generally preferred for international comparisons, given the volatility of currency markets and related factors, data users should note that available PPPs are designed for GDP and not R&D and may be significantly revised in future PPP benchmarking exercises. Comparisons between the United States and China in EXR-adjusted terms indicate that China’s R&D was about 50 % that of the United States in 2024, up from 44 % in 2014 and 8 % in 2004.
Using the 2020 base year PPPs as reference is equivalent to assuming that 4 yuan purchase the same volume of R&D inputs in China as 1 dollar in the United States, instead of 6 as implied by the exchange rate or 3.5 as per latest PPP estimate, would place China at approximately 90-95 % of US’s R&D in 2024 rather than 102 % with the 2024 PPP ratio. Comparisons between the United States and the European Union show that, in PPP-adjusted terms, EU R&D stood at 60 % of that of the United States, down from 70 % in 2014. In EXR-adjusted terms, the EU area stood at 43 %, down from 57% in 2014.
R&D intensity in the OECD area remains unchanged, China catches up
R&D intensity, a headline measure of R&D expenditure relative to GDP, remained at 2.7 % in 2024, unchanged since 2020. China’s R&D intensity has caught up with that of the OECD area in 2024, having previously surpassed the European Union, where R&D intensity has remained unchanged at 2.1 % since 2020. Among OECD countries, Israel and Korea continued to report the highest levels of R&D intensity, at 6.8 % and 5.1 % of GDP, respectively.
Government R&D budgets decline in 2024 and 2025 while reorienting from energy and the environment to defence
Revised data on Government Budget Allocations for R&D (GBARD) in the OECD area point to a larger than anticipated inflation-adjusted decline of 4.1 % in 2024, following a 0.7 % increase in 2023. Data on the socioeconomic objectives of government R&D budgets show reductions across most categories in 2024, with defence (+1.2 %) and support towards General University Funds (+2.1 %) as the main exceptions. Growth in defence R&D budgets was particularly marked in the EU27 (+11.5 %) and Japan (+17.9 %). Energy and environment-related GBARD fell by 8.0 % after significant growth in previous years.
While intended to provide a timely picture of government support intentions for R&D, most OECD countries have not yet submitted official and internationally comparable estimates of their government R&D budgets for 2025 as of March 2026. Among the nine countries that have, GBARD declined by over 5 % in real terms in 2025, including a 7.9 % decrease in the United States. A more complete assessment of 2025 GBARD trends will be available in September 2026.