Beloved soda brand celebrates milestone with worldwide events, sweepstakes, and limited-edition releases
Commemorating 75 years of tradition, culture, and quintessential flavours, Jarritos, the authentic Mexican soda brand known for its refreshing and bold taste, is celebrating the way it does best – boldly, colourfully, and with a lot of corazón. To mark this milestone, Jarritos is launching a worldwide anniversary celebration, featuring a specialty sweepstakes, pop-up events in major cities around the globe, vintage-inspired packaging, and more.
(Photo: Jarritos)
From its humble beginnings in 1950s Mexico to worldwide acclaim, Jarritos has grown from a soda underdog into a cultural icon, transcending generations and borders with its signature bottles and distinct fruit-forward flavours. Expanding its offerings to include innovations like Jarritos Zero and Jarriboba, as well as extending its cultural impact through collaborations with renowned brands including Nike, Wolverine, Native, Marine Layer, and Abercrombie, Jarritos continues to evolve and build meaningful connections, one bottle at a time.
To honor its rich history and the communities that have supported it along the way, Jarritos is celebrating authenticity, culture, and flavour, while showing deep appreciation for its fans around the world.
75th anniversary sweepstakes
As a thank-you to fans, Jarritos will be hosting a weekly giveaway starting in September, offering special prizes that celebrate the brand’s heritage and vibrant culture. Winners will have the chance to receive authentic Mexican art pieces sourced from different regions of the country, limited-edition collaboration items such as the coveted Jarritos x Nike SB Shoes and Jarritos x Wolverine Boots, custom Jarritos mini fridges, and even a one-year supply of Jarritos and Jarritos Zero. Additional prizes include exclusive merchandise, gift cards, and other unique items that highlight the spirit and authenticity of the beloved soda brand.
Global pop-up events
Jarritos is bringing the fiesta to major cities around the globe, including Madrid, London, Sydney, Toronto, Dubai, Paris, Berlin, Puebla, and more. Highlights include a riverboat mariachi performance in Paris, a one-of-a-kind, immersive pop-up in Toronto, featuring interactive installations, product sampling, and exclusive merch, as well as a nationwide giveaway across Canada restaurants, where the first 75 customers at select locations will receive a free Jarritos.
Vintage-inspired packaging
Jarritos is honoring its roots with millions of family-size bottles featuring retro label designs, along with 500,000 commemorative soda packs that include $ 75 in savings, adding up to millions of dollars in potential coupon value for fans.
The Authentic Story of Jarritos
To commemorate its legacy, Jarritos is releasing a never-before-seen editorial piece developed in collaboration with the Latino history and origins platform Nuestro Stories, The Authentic Story of Jarritos. Chronicling the brand’s journey, this editorial feature celebrates the legacy of its founders, provides fans with an inside look into the brand’s journey, and shares behind-the-scenes stories from those who helped shape its success.
To join in on the celebration and learn more about Jarritos, visit https://jarritos.com/. To enter the 75th anniversary sweepstakes, visit here.
On 3 June 2025, the US announced it would impose 50 % tariffs on all steel and aluminum imports. This move represented an escalation compared to the 25 % tariff previously imposed on such imports on 10 February 2025. These policies create challenges for US manufacturers and users of packaging made of imported steel and aluminum. However, domestic recycling is enabling US aluminum can manufacturers to avoid the worst effects of tariffs, says GlobalData, a leading data and analytics company.
GlobalData’s recent report “Industry Insights: The impact of tariffs on consumer packaged goods” reveals which CPG-relevant sectors are most affected by tariffs within specific trade relationships and how companies in these sectors will be affected. It also provides insights into consumer reactions to changes in the market caused by the imposition of tariffs.
Rory Gopsill, Senior Consumer Analyst at GlobalData, comments: ” Unlike many other industries that rely significantly on metal imports, beverage can manufacturers in the US obtain a considerable share of their raw materials from recycled sources. The Aluminum Association reports that over 70 % of the aluminum utilised in domestic beverage cans is derived from recycled content. This closed-loop supply chain provides can manufacturers with a degree of insulation from US tariffs on imported aluminum as part of efforts to safeguard domestic industries and address trade imbalances with China and other exporting nations.”
In 2025, 99.6 billion rigid metal beverage cans are forecast to be sold in the US, according to GlobalData’s Primary Packaging and Outers Database. The Aluminum Association’s assertion that over 70 % of aluminum used in domestic beverage cans is recycled suggests that, of the total, 70 billion rigid metal beverage cans are made of recycled aluminum, leaving roughly 30 billion with significant exposure to tariffs on aluminum.
Tariffs create both opportunities and challenges for US recycling
Can manufacturers typically choose recycled aluminum over virgin aluminum because it is financially and environmentally less costly. This is because producing usable aluminum via recycling requires 95 % less energy than producing usable aluminum from scratch. In this respect, tariffs could create opportunities for US-based aluminum recycling plants as tariffs create yet more financial incentives for packaging manufacturers to utilise recycled materials. In other respects, however, tariffs create problems for the US’ recycling industry. For example, shipping recycled materials across national borders in North America is complicated by tariffs, with only US-Mexico-Canada Agreement (USMCA)-compliant goods being tariff exempt.
Gopsill concludes: “In a volatile economic climate, where global supply chains are increasingly politicised, the US beverage can sector’s embrace of recycled aluminum stands out as a model of resilience. By leveraging domestic, sustainable materials, the industry not only reduces environmental impact but also cushions itself from macroeconomic shocks – proof that circularity and competitiveness can go hand in hand.”
Freshfel Europe sent a letter to the European Commission warning that the proposed redeployment of existing EU funds away from promotional ‘multi programme’ activities could threaten the competitiveness of EU fruit and vegetables and hinder the progress on promoting the health and environmental assets of fresh produce.
Freshfel Europe, on behalf of the European fresh produce sector, submitted a letter responding to the EU Commission’s proposal to drastically reduce the agricultural promotion policy budget over the next three years by EUR 281.7 million, resulting in a total budget cut of over 50 % for this popular CAP policy. Worryingly, the budgets for ‘multi programmes,’ which involve multiple Member States as well as the Commission’s own promotion projects in third countries, have been scrapped entirely, only leaving in place the so-called “simple programmes.”
Freshfel Europe expressed concerns regarding the impact this would have on the EU fresh produce competitiveness and the continuity of essential promotion and marketing activities co-funded by the EU budget. Philippe Binard, General Delegate of Freshfel Europe stated: “While the EU decreases its promotion budget, global competitors such as the USA continue to invest millions to promote American food and farm exports. This underscores the urgent need to keep a strong EU promotion policy to maintain our competitive edge globally.”
A lacklustre promotion policy will also significantly and negatively impact the EU’s efforts to inform society and consumers about health and environmental issues relating to food diet. The latest estimation of daily fruit and vegetable consumption level is estimated at 340 g per person. This is well below the WHO minimum health recommendations of 400 g, driven by healthy diet considerations to address the challenges of non- communicable diseases and obesity. Furthermore, the Nordic Council has recommended reaching a minimum daily consumption of 800 g of fruit and vegetables: 400g for health benefits and an additional 400 g to offset negative environmental impacts. Clearly, 340 g is insufficient to address pressing health and environmental challenges The EU’s promotion policy and its co-funding opportunities are essential for sustaining much-needed promotion and information activities to communicate about the high health benefits and the low environmental impact of fresh fruit and vegetables. The role of fresh produce as “essential” and “public” goods needs to be properly voiced.
With these challenges in mind, Freshfel Europe is highly concerned about the disproportionate decreases in the promotion policy budget, especially for multi programme projects. The fresh produce sector has always shown a strong and growing interest in participating in multi programme projects across all EU Member States, as demonstrated by the 52 % increase in applications between 2023 and 2024. Philippe Binard added: “In a time of growing geopolitical instability, with economic uncertainty impacting consumers’ purchasing power and attitudes, and the need to promote the social and environmental benefits of fresh fruit and vegetables, it is crucial for the EU’s fresh produce sector to be well supported in a more cogent, cohesive, and coherent manner than has been proposed.”
With this latest move, the Commission is once again demonstrating a lack of consistency, coherence, and ambition to accompany the Green Deal strategy towards a plant diet. It is also significantly undermining its desired transition towards a more sustainable food chain. Within already limited financial resources, the budget is one of the only tools that can drive consumer attitudes towards a better diet, in alignment with the Farm to Fork strategy and Europe’s Beating Cancer Plan. Phillippe Binard commented: “This is a very short- term vision. This approach by the Commission ignores the indirect long-term huge financial burden on the healthcare systems due to unhealthy diets. The World Economic Forum estimates that EUR 2 is needed for each EUR 1 spent on food to remedy the cost of an inappropriate diet.” He concluded: “This budget redeployment is not only a very bad management choice in regard to the return on investment and efficiency of the promotion policy, but it will be financially very detrimental in the medium to long term for society.”
Freshfel Europe is calling on the Commission to review its position and not to undermine the effectiveness of a popular policy of its CAP. With the proliferation and acceleration of multiple crises impacting the agricultural sector, a strong promotion policy remains more relevant than ever for both the internal and international markets.
Tractor, in partnership with HowGood, launched the Organic Impact Tracker in 2023, becoming the first beverage brand to track and disclose impact data about its ingredients.
Tractor Beverage Company, the trailblazing pioneer of Certified Organic, Non-GMO beverages exclusively for the food service sector, and HowGood, a sustainability intelligence platform with the world’s largest ingredient sustainability database, are proud to have been recognised by Fast Company’s 2024 World Changing Ideas Awards for the Organic Impact Tracker.
In 2023, Tractor and HowGood partnered to release the Organic Impact Tracker, a sustainability impact tracker that uses five metrics to quantify the benefit of sourcing organic ingredients versus their conventional counterparts: synthetic pesticides avoided, organic land supported, carbon emissions avoided, water saved, and improved soil health. As the first and only organic company dedicated to food service, Tractor is also the only company in the world to track Synthetic Pesticides Avoided as part of its impact reporting.
“We’re honored by Fast Company’s recognition of our achievement,” stated Kevin Sherman, CEO of Tractor Beverage Company. “Over the past year, Tractor has steered clear of 34 tons of synthetic pesticides, a significant step towards leaving a better world for future generations. With HowGood’s assistance, we’re setting a new bar for accountability and transparency in the food and beverage industry and demonstrating our commitment to prioritising people and the planet over pesticides.”
HowGood supports food and beverage companies across the value chain to measure, manage, and communicate their sustainability impact. Tractor’s Organic Impact Tracker is powered by HowGood’s calculations, drawing from a database of over 90,000 agricultural emission factors.
Through their Fast Company award-winning Organic Impact Tracker (OIT), HowGood and Tractor have empowered Tractor’s Pouring Partners and consumers to have a global impact. In 2023 alone, Tractor:
Avoided 729.4 tons of carbon emissions
Supported 3882.9 acres of organic land
Saved 187,453.3 gallons of water
Contributed to 3882.9 acres of improved soil health
Avoided 34.04 tons of synthetic pesticides
“Now more than ever, it’s important that companies at every stage of the food value chain are collaborating to achieve impact reduction goals,” said Alexander Gillett, CEO of HowGood. “Partnering with Tractor to power their trailblazing sustainability transparency has made it possible for restaurants and consumers to make informed, responsible sourcing decisions. We applaud Tractor’s innovative approach to sustainability and are honored to have provided the model and calculations to make it possible.”
HowGood powers sustainability transparency across the food industry, working with food and beverage companies to calculate and share their impact data, drive impact reduction for carbon, water, biodiversity, and more, and make verified sustainability marketing claims. One of HowGood’s customers, Chipotle, has leveraged HowGood’s ingredient-level data in their “Real Foodprint” menu feature, demonstrating radical transparency in their public communications.
Since 2020, Tractor has also partnered with Chipotle to pour drinks that serve a purpose. Beyond pouring certified organic drinks, Chipotle donates 5 % of profits from Tractor Beverage sales to support farmers.
“We are proud to partner with Tractor Beverages, a company that offers delicious, all-natural drinks and shares our commitment to using real ingredients while supporting the farming community,” says Chris Brandt, Chief Brand Officer at Chipotle. “Organisations like HowGood and Tractor are helping to create lasting change throughout the food system, and we applaud their transparency as a means to drive progress.”
About Tractor Beverage Company Tractor Beverage Company is revolutionising the beverage station as the first and only USDA Organic Certified, Non-GMO full-line beverage solution for food service. Farmer-founded and employee-owned, the team is on a mission to create a cleaner, healthier planet, one drink at a time. 136 million+ Tractor drinks are served annually in more than 7,500 locations across 50 states in the US, with a portfolio of 25 uniquely flavoured Certified Organic and Non-GMO craft refreshers, lemonades, and premium craft sodas as well as organic frozen and organic mixology. Tractor’s thoughtfully crafted drinks feature clean ingredients that deliver on taste, functionality, and experience, without any of the bad stuff. Tractor is the first beverage brand to track and disclose impact data about its ingredients through the Organic Impact Tracker, quantifying the benefit of sourcing organic versus conventional ingredients. The company was included on the 2023 and 2022 Inc. 5000 lists of America’s fastest-growing private companies, and on Fast Company’s 2021 list of the world’s Most Innovative Companies.
About HowGood HowGood is an independent research company and SaaS Sustainability Intelligence platform with the world’s largest database on food product sustainability. With more than 90,000 agricultural emissions factors, HowGood helps leading brands, suppliers, retailers and restaurants to measure, reduce, and communicate their environmental and social impact. Through in-depth, ingredient-level insights into factors like greenhouse gas emissions, biodiversity, labor risk, animal welfare, and other key impacts, HowGood’s data power strategic decision-making for the sourcing, manufacturing, merchandising, and marketing of sustainable products.
Tate & Lyle and Cryptobiotix’s breakthrough ex-vivo* study shows that sucralose does not impact the gut microbiota, while other low and no calorie sweeteners have potentially beneficial health effects
A new, first-of-its-kind study has identified unique and potentially beneficial interactions between certain low and no calorie sweeteners, including stevia, and the human gut microbiota. Tate & Lyle PLC, a world leader in ingredient solutions for healthier food and drink, partnered with Cryptobiotix, pioneers in preclinical gastrointestinal research, on the study.
Dr. Davide Risso, molecular biology specialist and Tate & Lyle’s Head of Nutrition Research, led the project to explore the potential impact of certain low and no calorie sweeteners on the gut environment in both healthy individuals and those with type 2 diabetes. The research involved taking samples from co-living adults consuming a similar diet – to lower the potential variation introduced by differences in long-term diet, a major driver of microbiota composition. The doses of low and no calorie sweeteners used were based on actual intakes, regulations and amounts that are generally included in foods and beverages during different timepoints.
Results from the pre-clinical study, published in the leading peer reviewed, open-access journal the International Journal of Food Sciences and Nutrition, found that some of the studied low calorie and no calorie sweeteners had no impact on the gut microbiota, while others had potential beneficial health effects.
Using Cryptobiotix’s cutting-edge SIFR® (“cipher”) technology to recreate the gut environment outside of the human body, the research partners found that sweeteners, such as sucralose, do not impact the microbial composition of the gut. Furthermore, other sweeteners, including stevia, have a beneficial impact on the gut microbiota as they were found to be easily fermented and increase the density of certain health-supporting bacteria, with the production of short-chain fatty acids.
The study adds to the strong scientific evidence demonstrating the beneficial role low and no calorie sweeteners can play when used as a part of a balanced diet. Assessments of additional low and no calorie sweeteners, including allulose and erythritol, are being completed and details will be shared in due course.
Dr. Davide Risso, Tate & Lyle’s Head of Nutrition Research, said:
“In this study, the low and no calorie sweeteners we have assessed are shown to have either no impact on the gut microbiota or to offer potential health benefits beyond their established sugar and calorie reduction benefits. Human clinical trials will be required to confirm the potential health benefits. At Tate & Lyle, we’re committed to advancing understanding around the role of low and no calorie sweeteners in the diet and sharing knowledge in this emerging field as a purpose-led, science-driven company.”
Dr Pieter Van den Abbeele, Cryptobiotix’s Chief Scientific Officer, said:
“Cryptobiotix was founded with the ambition of providing accurate insights into the impact and behaviour of ingredients in relation to the gut microbiome. This study provides much-needed evidence to consider the potential benefits of sweeteners individually, rather than as a uniform whole. The robustness and validation work that went into the SIFR® technology used, allowed us to pinpoint specific health-promoting pathways in relation to specific low and no calorie sweeteners.”
*In ex vivo studies, living tissues are directly taken from a living organism and studied in a laboratory with minimal alterations to the organism’s natural conditions.
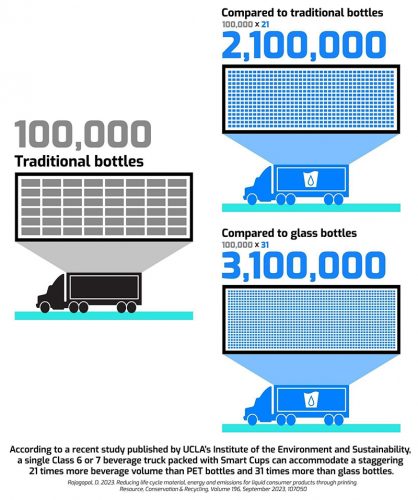
More Delivered, Less Trucks Needed! Smart Cups’ efficient technology means fewer transportation vehicles needed with greater volume of products delivered. (Photo: Smart Cups)
Smart Cups, a pioneering sustainability-driven technology company behind innovative ingredient printing announced the publication of a new research study in the esteemed journal Resource, Conservation & Recycling. The study, titled “Reducing life cycle material, energy and emissions for liquid consumer products through printing,” conducted by UCLA’s Institute of the Environment and Sustainability and authored by Professor Deepak Rajagopal, has brought to light the remarkable potential of Smart Cups Technology in transforming the consumer-packaged goods industry and contributing to a greener future.
“The technology that Smart Cups has pioneered has the potential to drastically reduce the environmental burden of beverages and several other liquid products through a reduction in total packaging and transportation across the product lifecycle,” said Professor Deepak Rajagopal. “The implications of this research extend beyond the consumer-packaged goods industry. Major companies, including industry giants like Pepsi, Coke, and Proctor and Gamble, could benefit from Smart Cups’ ground-breaking approach to delivering products more sustainably. Embracing this innovation can help such large corporations achieve sustainability goals and become leaders in eco-friendly practices”.
The study focuses on the profound environmental benefits of Smart Cups Technology which enables direct printing of consumer product ingredients onto surfaces, leading to substantial reductions in packaging materials, energy consumption, carbon emissions and overall environmental burdens. The study unveils the far-reaching implications for not just the beverage industry, but also the consumer-packaged goods industry as whole, promising to revolutionise distribution logistics and minimise environmental impact.
Key highlights from the study include:
The study’s findings show that a single Class 6 or 7 beverage truck packed with Smart Cups can accommodate a staggering 21 times more beverage volume than PET bottles and 31 times than glass bottles.
Smart Cups printed on PLA cups, when paired with tap water, result in 20 % less packaging materials than aluminum, 40 % less than plastic, and an impressive 90 % less than glass-based packaging.
This reduction in packaging translates into a 23 % to 48 % decrease in lifecycle primary energy and a 40 % to 57 % decrease in global warming potential. With biogenic carbon credit for landfilled PLA, the reductions reach an impressive 50 % to 70 %.
Smart Cups Technology is the first of its kind, revolutionising the delivery of liquid consumer products and minimising their environmental impact. This research not only amplifies the positive impact Smart Cups Technology can have on the world but also strengthens the validation of its significant benefits by reshaping the consumer products industry. By eliminating the need for bulky packaging materials, such as PET bottles or glass containers, Smart Cups optimise beverage payload, allowing for substantially higher volumes to be transported within the same truck weight limits. This breakthrough not only enhances logistical efficiency but also reduces the carbon footprint associated with transportation, as fewer trucks are required to transport the same amount of beverage.
The implications of this research extend far beyond the immediate benefits of increased payload capacity. By revolutionizing beverage transportation, Smart Cups are poised to transform the entire industry landscape, introducing a new era of sustainability and efficiency. With the potential to streamline distribution networks and reduce reliance on fossil fuels, Smart Cups offer a visionary solution to the pressing environmental challenges faced by the beverage sector.
The UCLA study underscores the profound impact of Smart Cups on beverage transportation, highlighting the unparalleled payload capacity that this innovative packaging technology provides. As industry leaders and consumers alike seek more sustainable and efficient solutions, Smart Cups stands at the forefront of a transformative movement. The researchers at UCLA are confident that their findings will inspire further exploration and adoption of Smart Cups within the beverage industry, ultimately leading to a greener, more efficient future.
The climate impact of food is important to Europeans. Three out of five consumers consider climate impact when buying food according to a new survey by Yara.
Yara International announced the findings in a new European survey on sustainable food conducted by leading international market research company IPSOS on behalf of Yara. The report provides an overview of consumer purchasing habits and sustainable food preferences.
“The report shows that Europeans are highly motivated to buy sustainable food to reduce their climate impact. This should be a wake-up call to the entire food industry,” says Birgitte Holter, VP of Green Fertilisers at Yara. “While three out of five Europeans find the climate impact important when buying food, a majority feel it is not easy enough to understand available information about the climate emission to be able to make sustainable choices. More than three out of four consumers would prefer to be able to read the carbon footprint on the food item,” Holter says.
The world’s food production accounts for more than a quarter of global greenhouse gas emissions. This new report shows that 58 % of Europeans consider the climate impact important when buying food and beverages. In addition, 51 % of Europeans are willing to pay more for fossil free food items, meaning food produced without fossil sources. However, most people feel that it is not easy to know which food is climate friendly, as 76 % of Europeans would like the carbon footprint to be visible on the food label.
“Decarbonisation of food is possible and that is why we are developing green fertilisers made from water and air using renewable energy, to support farmers and food companies in reducing their climate impact of their food. These voluntary choices must be supported by adequate policies. The EU’s Sustainable Food System initiative, planned for the end of 2023, should therefore create a set of incentives for food systems’ actors to go beyond the minimum requirements and favor low-carbon footprint solutions such as green fertilisers,” says Holter.
In Porsgrunn, Norway, Yara is building the first production plant to run on renewable energy. From here, Yara will produce green fertilisers made without the use of fossil energy or fossil sources. This will result in crops with an up to 30 % lower carbon footprint and up to 20 % carbon footprint reduction in the food produced, making them a powerful solution to grow a decarbonised and fossil free food future. The first green fertilisers are planned to enter production in the second half of 2023.
The market demand for food made without fossil energy sources is high. More than half of Europeans (51 %) said they are willing to pay more for climate friendly food. A clear majority of Europeans (74 %) say food companies need to work to reduce the emissions from their food production.
Key findings in this survey:
58 % of Europeans consider the climate impact important when buying food and beverage items
69 % of Europeans would choose a climate friendlier food item versus a cheaper option. (26 % would choose a fossil free food item, 43 % would choose a low-carbon item)
51 % of Europeans say they are willing to pay more for food made without fossil fuel sources
31 % of Europeans already make sustainable choices when it comes to their buying habits
More than three out of four (76 %) Europeans want to see the carbon footprint of food items on the label
Nearly three out of four Europeans (74 %) believe food companies should work to reduce emissions in their food production
About the survey The survey on the need for sustainable food was commissioned by Yara International and conducted by IPSOS. The panel consisted of 12,000 consumer respondents in France, Germany, the United Kingdom, Ireland, Italy, Spain, Poland, Romania, Turkey, Norway, Sweden and Denmark (1,000 respondents in each country). The data was collected from online interviews during the period of December 1 – 14, 2022.
Despite being digital natives, Gen Z consumers have started to exhibit some self-awareness and are questioning if all-encompassing tech usage is good for them. New Mintel research indicates that while 51 % of Gen Z Canadians (aged 13 – 17) cite a desire to integrate more tech into their lives, nearly the same percentage (47 %) also agree that social media and large amounts of tech usage have a negative impact on their mental health. In fact, 47 % say they are trying to limit their social media usage.
When examining the platforms that Gen Z uses, all of them rely heavily on visual interaction: Mintel research shows Gen Z Canadians engage with YouTube the most (77 %), followed by Instagram (75 %), Snapchat (58 %), and TikTok (52 %).
Michael Lloy, Senior Technology Analyst, Mintel Reports Canada, said: “Our research shows that due to significantly more time spent on these platforms, a portion of Gen Z has become more aware of their mental health and are exploring ways to reduce their usage of social media. This indicates that there is growing discontent among younger consumers about the negative effects that social media has on their lives, which may prompt radical behaviour shifts away from social media as they age. This will require brands to think strategically about how and where they market to Gen Z consumers as they age in order to develop and sustain an engaged and loyal audience.”
Reduced screen time in favor of better mental health
Gen Z consumers use of social media is a behavioural trait that sets them apart from other demographics. They are a heavily plugged-in generation with 51 % saying they are on the hunt to find technology to make their lives easier, more efficient, or more exciting. What’s more, 64 % say they engage with social media more than TV/movies.
However, nearly half of Gen Z (47 %) agree that social media has a net negative effect on their mental health and nearly all (95 %) agree that mental health is just as important to maintain as physical health.
“Gen Z reducing their screen time due to mental health concerns presents an opportunity for brands to lean into the visibility of their values in order to be seen to support causes that Gen Z cares about. Both Millennials and Gen Zs are heavily plugged-in generations, but there are a few, notable differences when it comes to social media. First, while Gen Zs are digital natives, most Millennials are not, and this informs the speed at which each generation adapts to new technology. Life stages are another piece of the puzzle. Millennials are a split generation. Some Older Millennials are married, homeowners, have children, or some combination of the three, while some Younger Millennials are closer to Gen Z in their life stages. These key differences will be important for brands to remember as they market to Gen Z consumers moving forward.”
The metaverse fails to make an impact
Since its launch in late 2021, the metaverse has been a popular topic for brands but has made less of a splash among consumers. Mintel research shows only 3 % of Canadian Gen Z consumers actually use the metaverse and 26 % have never heard of the metaverse before now.
“As many Canadian consumers are getting back to their pre-pandemic lifestyles, including in-person gatherings, the lack of eagerness to interact with the metaverse has been evident. Overall, only 15 % of consumers, on average, can even envision a world where they interact using the technology, meaning brands that currently or plan to leverage the metaverse in their marketing strategy have some work in front of them in order to convince consumers of the metaverse’s usefulness and applicability to their daily lives,” concluded Lloy.
Euromed’s natural ingredient Pomanox® shows potential to help reduce food intake
According to a recently published clinical study by the department of Dietetics, Nutrition and Biological Sciences, those supplementing with Euromed’s natural extract Pomanox® showed significantly lower levels of hunger and a desire to eat, as well as higher levels of satiety, compared to a placebo group.
In the preliminary, independent, placebo-controlled study conducted at Queen Margaret University, Edinburgh1, twenty-eight healthy subjects were given either three-week supplementation with Pomanox® or a placebo. During week three, satiety parameters were determined on a testing day after participants ingested breakfast and lunch with pomegranate juice (PJ). The results suggest that subjects in the Pomanox® group with the PJ preload were generally more satisfied than those given the placebo. Participants were also less hungry after Pomanox® intake with PJ during the meal than those who consumed placebo juice and capsules. Scores from the visual analogue scales (VAS), which record subjective sensations, showed significantly lower levels of hunger and a desire to eat, as well as higher levels of fullness and satisfaction, thus greater levels of satiety in participants consuming Pomanox® with PJ, compared to the placebo. These participants also liked the smell of the meal significantly more than the placebo group. Interestingly, the consumption of pomegranate extract was associated with a significantly lower amount of food intake during the satiety session compared with the placebo group.
While preliminary, these findings confirm the appetite-regulating effect of polyphenol-rich extracts reported in previous studies, suggesting possible novel new approaches to reducing risk factors for obesity and compulsive eating, and providing more enjoyable meals while dieting.
Andrea Zangara, Scientific Marketing Manager at Euromed, says: “We are very pleased to see these promising results, as they further support the efficacy and safety of Pomanox®, expanding its numerous evidence-based health applications to include weight management and behavioural support. Pomanox® is available in different formats and strengths, and extracted using safe and eco-friendly, water-only technologies (Pure-Hydro Process®) as with all the other ingredients in our line of Mediterranean Fruit and Vegetable Extracts™. Their production is vertically integrated as they originate from selected fruits grown in the Mediterranean region – close to our dedicated manufacturing plant and in accordance with strict and transparent quality control protocols. In summary, they are ideal for inclusion in premium dietary supplements, functional foods and pharmaceuticals.”
Europeans have an average per capita purchasing power of €13,894 in 2020. However, disposable net income among the 42 studied countries varies significantly. Liechtenstein, Switzerland and Luxembourg have the highest disposable net income, while Kosovo, Moldova and Ukraine have the lowest. Liechtensteiners have more than 37 times the average purchasing power of Ukrainians. These are some of the results of the newly released study “GfK Purchasing Power Europe 2020”. This year, the study also includes the Corona Impact Index, which illustrates the impact of COVID-19 on European countries.
Europeans have just under €9.5 trillion at their disposal in 2020. This corresponds to an average per capita purchasing power of €13,894. Per capita purchasing power shows a nominal decline of almost 5.3 percent in 2020 compared to last year’s revised value, which can be attributed mainly to the spread of COVID-19 and the resulting economic impact. The rankings show substantial differences between the studied countries with respect to the amount available to Europeans for food, living, services, energy, private pensions, insurance, vacation, mobility and consumer purchases.
Ireland enters the top ten
Liechtenstein once again takes first place among the 42 European countries with a per capita purchasing power of €64,240. This far exceeds the values of the other countries and is more than 4.6 times the European average. Completing the top three of the purchasing power rankings are Switzerland and Luxembourg, as was the case last year. The Swiss have €41,998 per capita available for spending – more than three times the European average – while Luxembourgers have a per capita purchasing power of €34,119. This is more than 2.5 times the European average.
All other countries in the top ten also have significantly above-average per capita purchasing power – at least 50 percent higher than the European average. Ireland makes it into the top ten this year with a per capita purchasing power of €21,030, putting it in ninth place and ousting Finland from the top ten.
Sixteen of the countries considered by the study have above-average per capita purchasing power, while twenty-six fall below the European average. Ukraine takes last place with a per capita purchasing power of €1,703.
Markus Frank, expert in GfK´s Geomarketing solution area, comments: “GfK Purchasing Power Europe is a recognized benchmark in the market for calculating consumer potential and shows the regional distribution of disposable income among the population – between individual countries as well as between the various regions within a country. In the midst of the coronavirus pandemic, it is important for companies to know where purchasing power and regional potential is highest in order to be able to make the best possible use of resources. Purchasing power is an important benchmark for the economic strength of a given region, and helps companies make business decisions related to sales management and marketing as well as location planning and evaluation.”
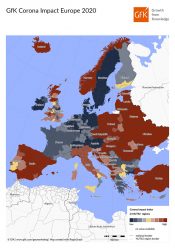
Corona Impact Index shows the effect of COVID-19 on European countries
With the Corona Impact Index, GfK has also calculated the extent to which European countries have suffered as a result of the effects of COVID-19. The Corona Impact Index shows the differences in loss of prosperity among private households as a result of the coronavirus crisis, thus facilitating both national and regional comparisons within Europe. In the purchasing power top ten, Liechtenstein and Switzerland top the rankings with the highest disposable net income per capita in Europe. They are also the two countries that have suffered least as a result of the crisis. The impact of the coronavirus in Liechtenstein is around 85 percent below the European average, while in Switzerland it is around 74 percent below the European average. Iceland and Norway, which occupy fourth and fifth places in the purchasing power rankings, fare less well in the Corona Impact Index and are 58 and 63 percent above the European average respectively. Both countries have been hit particularly hard by the coronavirus pandemic, one of the reasons being the devaluation of their national currencies against the euro. Occupying last place among the 42 countries in the rankings is Turkey, where the Corona Impact Index is more than 2.8 times the European average.
The Corona Impact illustrates the differences in loss of prosperity among private households as a result of the coronavirus crisis, thus facilitating both national and regional comparisons within Europe. Liechtenstein (index: 15.2; European average = 100), Switzerland (index: 26.1) and Sweden (index: 37.1) have suffered least as a result of the coronavirus crisis. Occupying last place among the 42 countries in the rankings is Turkey (index: 281.2), where the Corona Impact is more than 2.8 times the European average. (Photo: GfK)
“The coronavirus crisis has had a significant effect on disposable net household income,” explains GfK expert Markus Frank. “However, there are regional differences. The Corona Impact Index therefore provides companies with useful data that illustrate the “forecast gap”, in other words the gap between the potentially achievable growth path for disposable income of private households before the outbreak of COVID-19 in Europe and the now expected national purchasing power level according to the 2020 purchasing power forecast. This data makes it possible to identify the regions that have suffered most as a result of the crisis and those that have suffered least.”
Comparison of select countries and regions
Below is a more detailed evaluation of the distribution of purchasing power in Italy, Spain, the Czech Republic, Poland, Hungary and Romania. A comparison of these countries offers insights into the regional distribution of spending potential within the respective countries.
Italy: Affluent north and poorer south
In Italy the average per capita purchasing power is €16,439. This puts Italians around 18 percent above the European average and in sixteenth place among the 42 countries considered by GfK’s study.
There is a significant north-south divide in the distribution of purchasing power between Italy’s affluent north and poorer south. All of the provinces in the top ten are located in the north of Italy. The province of Milano remains at the top of the rankings. The area around the fashion metropolis has a per capita purchasing power of €23,507, which is 43 percent above the national average and more than 69 percent above the European average. New to the top ten is the province of Firenze, which occupies tenth place and ousts the province of Valle d’Aosta/Vallee d’Aoste from the top ten. The provinces of Monza e della Brianza and Genova switch fifth and eighth places in the rankings.
The ten least affluent provinces are all located in southern Italy. Last place goes to Crotone, which is situated in the country’s far south. Inhabitants of this province have a per capita purchasing power of €9,119, which is around 45 percent less than the national average and around 34 percent less than the European average.
Spain: Alone in the midfield
Spain has a 2020 per capita purchasing power of €13,613, which puts it just 2 percent below the European average. No other European country is close to this value – Italy is more than 18 percent above the European average, while Slovenia is just under 15 percent below the European average. This puts Spain alone in the European midfield.
In the ranking of the Spanish provinces, Araba/Alava, the southernmost of the three provinces of the Basque Autonomous Community, once again takes first place. Inhabitants of this province have €17,620 per capita for consumer purchases, which is more than 29 percent above the national average. There also have been a couple of changes in this year’s top ten. Bizkaia and Barcelona have switched fourth and fifth places. New to the top ten this year are the provinces of Zaragoza, Burgos and Asturias in places seven through nine, replacing last year’s top-ten provinces of Tarragona, Lleida and Girona.
Spain’s least affluent provinces are all located in the southwestern part of the country. While the Andalusian province of Cadiz occupied last place in the rankings in previous years, this year it moves up to second-to-last place. Taking last place in this year’s rankings is Spain’s largest province, Badajoz, with a per capita purchasing power of €9,975, which is around 27 percent below the national average.
Czech Republic: Highest purchasing power in and around the country’s largest cities
The Czech Republic has a per capita purchasing power of €9,179, which puts it almost 34 percent below the European average and in twenty-fifth place among the 42 countries in the study.
The capital city district of Prague once again tops the purchasing power rankings. Inhabitants of this district have €11,961 per capita available for spending and saving, which is more than 30 percent above the national average. However, the purchasing power of the inhabitants of Prague is still almost 14 percent below the European average. The two bordering districts of Praha-zapad and Praha-vychod also have above-average purchasing power, as does the Czech Republic’s second largest city, Brno-mesto.
There have been a few changes in the top ten this year, with Brno-mesto and Praha-vychod switching places three and four and Beroun, Hradec Kralove and Benesov also changing places in the rankings. A new entry this year is the district of Kladno, which secures the final place in the top ten with a per capita purchasing power of €9,328. Bringing up the rear in the district rankings is Jesenik in Northern Moravia, located on the border with Poland. The district’s inhabitants have a per capita purchasing power of €7,597, which is almost 83 percent of the national average and around 55 percent of the European average.
Poland: Sharp contrast between rich and poor
The average per capita purchasing power in Poland in 2020 is €7,143, just under 49 percent below the European average. This puts Poland in twenty-eighth place in the European rankings.
There is an especially large gap between rich and poor in Poland with respect to the distribution of purchasing power in the country’s 380 districts. Only 17 districts have a per capita purchasing power that is at least 20 percent higher than the national average. By contrast, 106 districts are at least 20 percent below the national average. With a per capita purchasing power of €12,120, the capital city district of Warsaw takes first place. Inhabitants of the capital district have almost 70 percent more money for consumer purchases and saving than the national average.
At the other end of the district rankings is Szydlowiecki, where the per capita purchasing power is just €4,721. This corresponds to almost 66 percent of the Polish average and 34 percent of the European average. Inhabitants of Warsaw have almost 2.6 times more money available than the inhabitants of the least affluent district of Szydlowiecki.
There has been little change in the top places of the purchasing power rankings this year. The districts of Krakow and Bielsko-Biala switch eighth and ninth places. Gliwice makes it into the top ten with a per capita purchasing power of €9,111, putting it in tenth place and ousting the district of Tychi.
Hungary: Purchasing power highest around capital city and toward the Austrian border
Hungary’s average per capita purchasing power is €6,871, which is a little less than half the European average. As such, Hungary is ranked thirtieth.
Looking at the 20 counties of Hungary, it is clear that the areas with the highest purchasing power have managed to hold on to their place in the rankings. The capital city county of Budapest continues to lead the rankings by a significant margin. With €8,627 per capita, inhabitants of Budapest have almost 26 percent more purchasing power than the national average, but still almost 38 percent less than the European average.
Five of Hungary’s 20 counties have above-average purchasing power. All of these counties are located in and around the capital city of Budapest and toward the Austrian border. By contrast, three-fourths of Hungary’s counties have below-average purchasing power. Last place goes to Szabolcs-Szatmar-Bereg, whose inhabitants have a per capita purchasing power of €5,392, which is less than 79 percent of the national average and around 39 percent of the European average.
Romania: Capital has by far the highest purchasing power
Romania is thirty-first in the European rankings, just below Hungary. With an average per capita purchasing power of €5,611, Romania is around 60 percent below the European average.
Like Poland, Romania has a very big gap between rich and poor. The capital city county of Bucuresti leads the rankings by a significant margin. Inhabitants of this county have €10,173 per capita available for spending and saving, which is more than 81 percent above the national average. The people of Bucharest have more than three times the purchasing power of the inhabitants of the least affluent county, Vaslui. Here, disposable net income is just €3,374, which is around 60 percent of the national average and just over 24.3 percent of the European average.
Arad, Arges and Prahova each move up one place in the rankings to positions seven through nine, while Hunedoara drops out of this year’s top ten. New in tenth place is the district of Alba, whose inhabitants have a per capita purchasing power of €5,747, which is more than 2 percent above the national average.
About the study The study “GfK Purchasing Power Europe 2020” is available for 42 European countries at detailed regional levels such as municipalities and postcodes, along with seamlessly fitting data on inhabitants and households as well as digital maps. Purchasing power is a measure of disposable income after the deduction of taxes and charitable contributions and including any received state benefits. The study indicates per-person, per-year purchasing power levels in euros and as an index. GfK Purchasing Power is based on the population’s nominal disposable income, which means values are not adjusted for inflation. Calculations are carried out on the basis of reported income and earnings, statistics on government benefits as well as economic forecasts provided by economic institutes. In cases where there are different scenarios from economic research institutes, the average scenario is always selected for the purposes of calculating GfK Purchasing Power 2020, which assumes a delayed recovery into next year along with the availability of effective medical treatments for the coronavirus in the middle of 2021. Consumers draw from their general purchasing power to cover expenses related to eating, living, services, energy, private pensions and insurance plans as well as other expenditures, such as vacation, mobility and consumer purchases. This year, GfK also releases the Corona Impact Index, which shows the differences in lost disposable net income due to the coronavirus crisis at national and regional level. Calculations are carried out on the basis of the latest information and forecasts for household net income, private household consumer spending and changes in gross domestic product. These values are assessed in relation to the forecasts prepared available before COVID-19. The resulting deviation is traced back to the effects of the coronavirus crisis. Exchange rate changes are also included in the calculation. For the purposes of regionalization of the Corona Impact Index, data on the industry structure in the regions is used along with country-specific values relating to short-time work and unemployment since the start of the pandemic. Unemployment and short-time working can illustrate the impact on the purchasing power of the population.
Freshfel Europe has released its Impact Assessment of the implications of the COVID-19 pandemic for the European fresh fruit and vegetable sector, including recommendations for policy-makers. In conjunction with its members, Freshfel Europe compiled the 88-page COVID-19 Impact Assessment to accurately outline the effect the pandemic has had on the sector over the last few months and what implications this may have in the short, medium and long-term for the supply of fresh produce to consumers.
Freshfel Europe’s COVID-19 Impact Assessment, which covers the effects of the pandemic on the European fresh fruit and vegetable sector until the beginning of May, provides an in-depth analysis of the implications of the health crisis for each stage of the supply chain. Freshfel Europe General Delegate Philippe Binard explained, “While the sector has been able to provide a continuous supply of fresh, safe and healthy produce to consumers during the pandemic, Freshfel Europe’s COVID-19 Impact Assessment reviews the key challenges that the sector has been confronted with over the last two months. This includes workforce, availability and protection, new logistics constraints, market performance as well as an analysis of the economic impact and added costs for the supply chain due to the pandemic”.
The COVID-19 Impact Assessment offers specific recommendations for policy-makers for each stage of the supply chain as well as for the fruit and vegetables sector as a whole. Further support will be needed for the sector to safeguard its competitiveness in the coming months and to secure the supply of fresh fruit and vegetables to consumers throughout 2020 and beyond.
Freshfel Europe’s COVID-19 Impact Assessment is available to download here, including a fact sheet summarizing the document’s main elements.
You need to load content from reCAPTCHA to submit the form. Please note that doing so will share data with third-party providers.
You are currently viewing a placeholder content from Turnstile. To access the actual content, click the button below. Please note that doing so will share data with third-party providers.