


U.S. concentrated orange juice import slumps to $48M in April 2023
In April 2023, supplies from abroad of concentrated orange juice decreased by -61.3 % to 16K tons for the first time since January 2023, thus ending a two-month rising trend. In general, imports showed a deep setback.
U.S. concentrated orange juice imports
In April 2023, supplies from abroad of concentrated orange juice decreased by -61.3 % to 16K tons for the first time since January 2023, thus ending a two-month rising trend. In general, imports showed a deep setback. The most prominent rate of growth was recorded in December 2022 when imports increased by 206 % against the previous month. In value terms, concentrated orange juice imports declined rapidly to $48M (IndexBox estimates) in April 2023. Over the period under review, imports showed a perceptible reduction. The pace of growth appeared the most rapid in October 2022 with an increase of 130 % m-o-m.
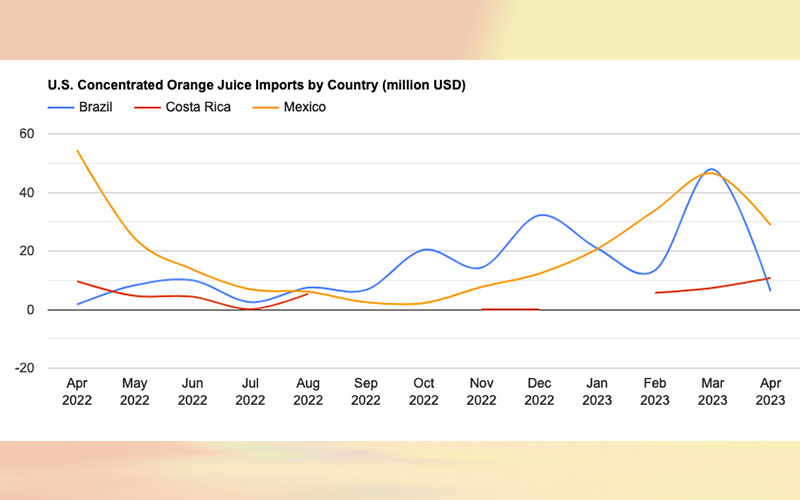
Imports by country
In April 2023, Mexico (9.2K tons) constituted the largest supplier of concentrated orange juice to the United States, with a 56 % share of total imports. Moreover, concentrated orange juice imports from Mexico exceeded the figures recorded by the second-largest supplier, Costa Rica (4.1K tons), twofold. From April 2022 to April 2023, the average monthly rate of growth in terms of volume from Mexico amounted to -8.1 %. The remaining supplying countries recorded the following average monthly rates of imports growth: Costa Rica (-2.3 % per month) and Brazil (+12.0 % per month). In value terms, Mexico ($29M) constituted the largest supplier of concentrated orange juice to the United States, comprising 61 % of total imports. The second position in the ranking was held by Costa Rica ($11M), with a 23 % share of total imports. From April 2022 to April 2023, the average monthly growth rate of value from Mexico amounted to -5.2 %. The remaining supplying countries recorded the following average monthly rates of imports growth: Costa Rica (+0.9 % per month) and Brazil (+11.3 % per month).
Import prices by country
In April 2023, the concentrated orange juice price amounted to $2,920 per ton (CIF, US), surging by 18 % against the previous month. Overall, the import price showed a pronounced increase. The growth pace was the most rapid in July 2022 when the average import price increased by 117 % month-to-month. As a result, import price attained the peak level of $4,563 per ton. From August 2022 to April 2023, the average import prices failed to regain momentum. Average prices varied somewhat amongst the major supplying countries. In April 2023, the country with the highest price was Mexico ($3,139 per ton), while the price for Brazil ($2,507 per ton) was amongst the lowest. From April 2022 to April 2023, the most notable rate of growth in terms of prices was attained by Costa Rica (+3.2 %), while the prices for the other major suppliers experienced mixed trend patterns.